
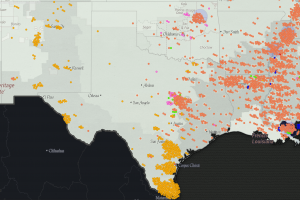
The website https://plaintalkhistory.com/monroeandflorencework/explore/ has some really great data visualization for lynchings in the United States between 1835 and 1964. The interactive map and timeline show the locations and dates of lynchings, and many of the thousands of markers link to additional information about the crimes and victims.
There is also a ton of historical information about lynching and white supremacy movements, as well as some discussion tools that would make this a great educational resource.
Much of the text is presented in a way to be accessible to high-school students, but I can guarantee that there’s plenty of fascinating an important history here, no matter what your age or education.
This post is a perspective of the author, and does not necessarily reflect the views of the Ronin Institute.